This page is part of the E3G Public Bank Climate Tracker Matrix, our tool to help you assess the Paris alignment of public banks, MDBs and DFIs.
| Paris alignment | Reasoning |
|---|---|
| Transformational | Prices align and go significantly above the High-Level Commission on Carbon Prices recommendation and are applied to all projects above the emission threshold. The shadow carbon price is based on a 1.5 degree IPCC scenario. |
The European Investment Bank applies a shadow carbon price, the table below provides a summary of how it is applied across bank operations. As part of its Climate Bank Roadmap, this price is being revised to align with a 1.5 degrees target and will be updated when this is released. E3G will update this analysis accordingly when new information is available.
| Which projects subject to greenhouse gas (GHG) assessment | 20ktCO2 net emissions (net emissions refer to the relative change in emissions i.e. estimated gross project emissions compared to the without-project baseline) OR Gross emissions over 100ktCO2 |
| Which projects apply shadow carbon pricing | All projects above threshold |
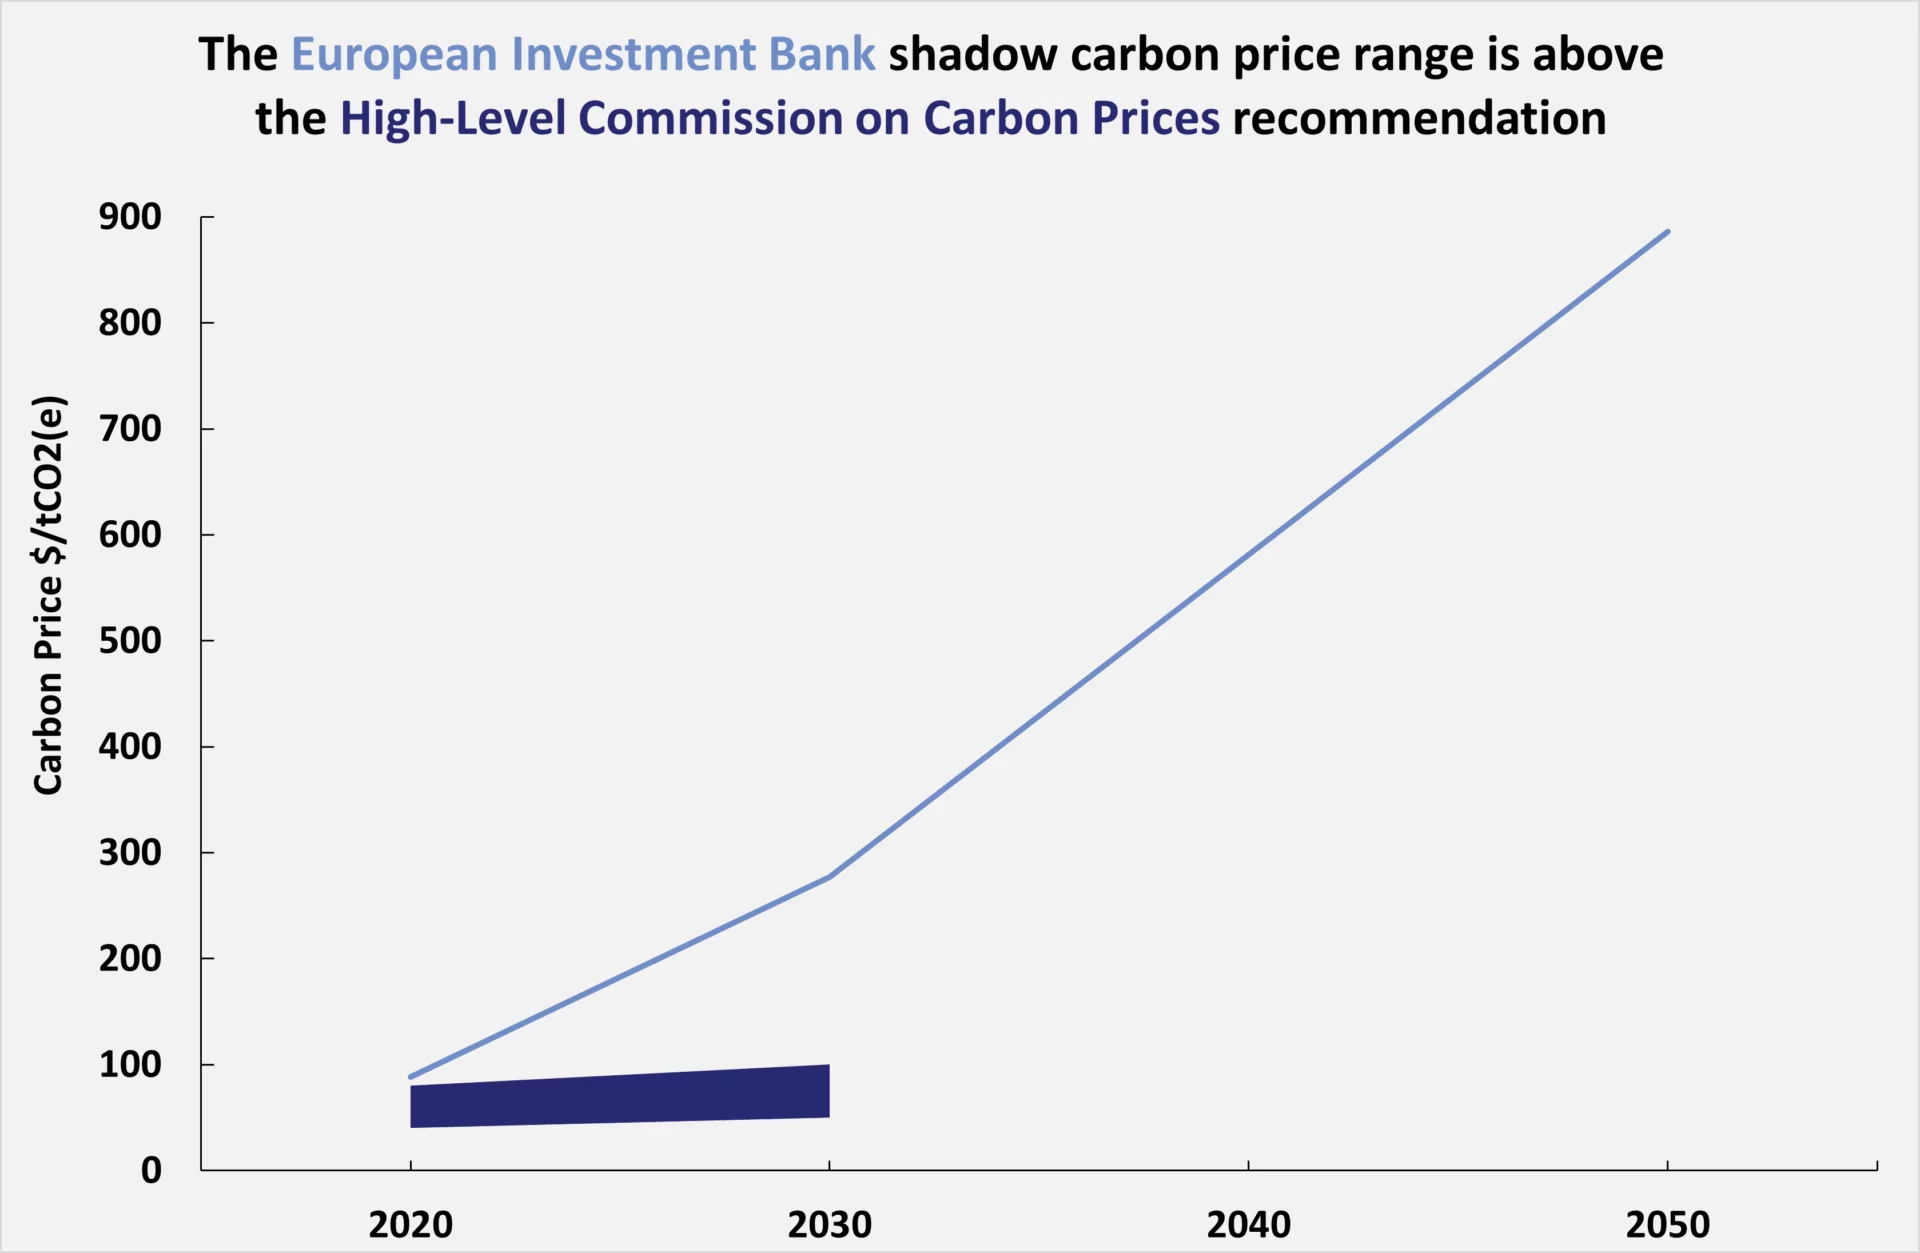
| Price level | EIB policy states its carbon price will be periodically updated in line with emerging research. EIB shadow cost of carbon will increase to €250 per tonne by 2030. By the time of net zero emissions in 2050, this shadow cost rises to €800 per tonne. |
| How shadow carbon price is used | Used for cost-benefit analysis for transport projects and cost-effectiveness analysis for projects in all sectors where cost-benefit is done (information received directly from the EIB). The shadow carbon price is used on the comparison between the project and the next best alternative. This is different to the carbon footprinting analysis, which compares to a baseline scenario. The high carbon price is used to appraise the economic case for low-carbon projects. The central carbon price is used to appraise the economic case for conventional technologies. |
| What is it compared to? | The carbon price is applied against the “best alternative” project. Further clarification is needed on how the “best alternative” is determined. For example, in its analysis of the Transadriatic Pipeline (TAP), EIB did not look at other options to achieve the same goal, e.g. curbing demand, renewable energy or increase interconnection but instead compared it to an alternative of an increase in Russian imports and USA LNG. It is unclear what is being used in road, aviation and rail projects, as projects in this field sometimes show GHG emissions savings. Country policy setting also important, for example if consumer electricity prices already had a carbon price included. |
| Are scope 3 emissions included? | E3G understands they are included for some projects. This includes all transport projects and some energy network projects and industrial installations. E3G us awaiting documentation for this. |
The graph below shows how the level of carbon pricing at the bank compares with those of the High-Level Commission on Carbon Prices (HLCCP). The HLCCP prices only extend to 2030.

Last Update: November 2020